Last week we reported statistics obtained from the the 2015 FBI annual report “Crime in the United States”, which officially ranked Niagara Falls as being the most violent city in New York State. Of course, this was not good news for a city that wishes to present itself to the world as a famous tourist destination, or at least the state park adjacent to it as a famous tourist destination.
To summarize, there were a total of 555 violent crimes reported for Niagara Falls for all of 2015. Based on a population of 48,989, that means that if you are a resident of the city of Niagara Falls, there was more than one chance in 100 that you were robbed, raped, murdered or assaulted last year.
The FBI also released “Property Crime” statistics, which include burglary, larceny, car theft and arson. Niagara Falls came in at an appalling 2,526 property crimes for 2015, at a per capita rate of more than one property crime for every 20 people who live here.
The FBI report was released just five weeks ago. The Niagara Falls Reporter, so far, is one of the only Western New York media outlets to deliver to its readers the bad news that the city of Niagara Falls, unfortunately, had the highest rate of violent crime in the state.
In light of these disturbing disclosures, a number of questions may fairly be asked. Over the past decade, beyond the distressing statistics that, after all, represent a life lost, ruined or certainly negatively-impacted in a profound way, has crime in Niagara Falls been trending up or downwards? Have Mayor Paul Dyster’s policies made any difference on crime rates in the city? Can he take credit for recent miniscule decreases in the crime rate, or are they attributable to other factors beyond his control?
To shed light on these matters, we dug deeper into the city’s crime statistics, utilizing the New York State Division of Criminal Justice Services index of crimes reported to police. These are the same numbers that the FBI draws on in compiling its annual report. We accessed earlier reports on the internet’s Wayback Machine website, going back to Mayor Dyster’s first year in office, 2009, and utilized the data to create graphical representations of crime trends since that year.
According to the US Census, as shown in Figure 1., the population of the city of Niagara Falls dropped by 2,379 from 2009 to 2015. That’s a decrease of 4.64%. Any downward trend in crime numbers, which in any case would be difficult to discern visually from Figures 2 and 3 and questionable in terms of statistical significance, over the period 2009 to 2015 should be adjusted to reflect that reality.
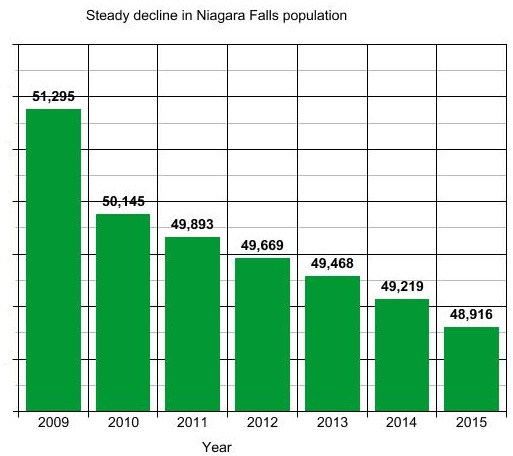
In other words, you would expect fewer crimes just on the basis of having fewer people, and nearly 5%, or one person in 20, fleeing this economically-challenged city, would most certainly be reflected to a greater or lesser degree in its crime statistics.
We’re willing to skip over Mayor Dyster’s first four years in office for purposes of this analysis. The great recession of 2007-2009 was in full swing, the aftereffects with us to this day. Policies take time to have impact.
Both property and violent crime peaked in 2012 in the city of Niagara Falls, and then declined somewhat (-14.5% and -10.3%, respectively) through 2015. Is the Mayor to be credited for these declines?
Possibly not, since property crimes across the state (excluding New York City) went down by 19.6% over the same time span. So the decrease in property crime from 2012 to 2015 is easily attributable to general state-wide trends, and the city didn’t even come close to matching the state’s performance in preventing property crimes.
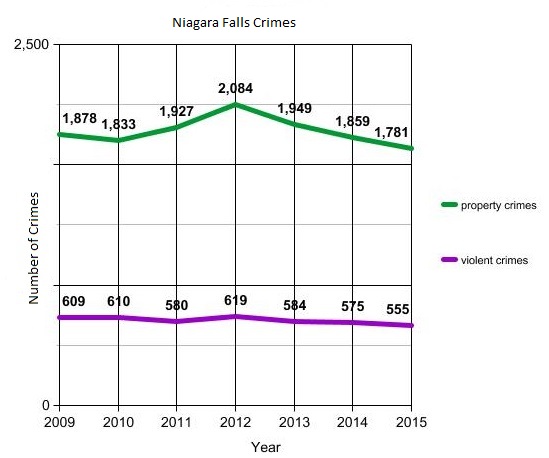
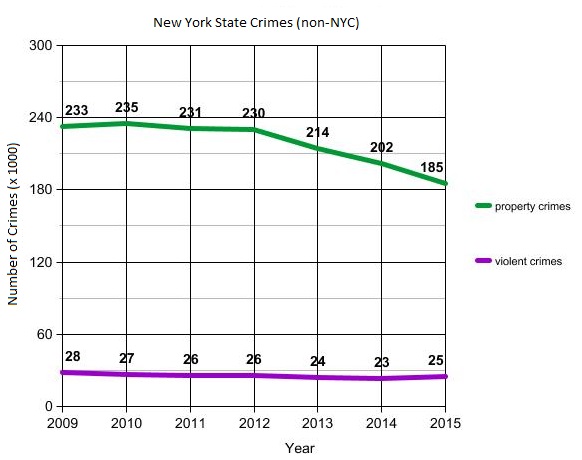
Similarly with violent crime. Getting past the overriding point that the city of Niagara Falls is now demonstrably more dangerous to live in than any other city in the state, a decrease of 10% over four years might seem notable, but as the graph shows, excluding the possibly stray 2015 data point, the state violent crime rate fell 11.5%.
Factor that in with the decrease in population (it stands to reason that fewer people living here means fewer people robbing, raping and killing each other) and the Niagara Falls 10% drop in violent crime doesn’t seem that impressive anymore, does it?